 solitarious nymph")
The EO4SD - Fragility, Conflict, and Security consortium completed a rapid evaluation to assess the use of EO data to detect the direct impact (damage) of the locust infestation on croplands in Ethiopia.
Geostationary weather satellite data from the European Organisation for the Exploitation of Meteorological Satellites (EUMETSAT) showed that exceptional and prolonged rainfall blanketed most of East Africa from October to December 2019. The unusual wet conditions, along with abundant vegetation in these areas, favored the development and spread of desert locusts. By early 2020, the outbreak of locust had spread into several countries, including Ethiopia, Kenya, Somalia, Tanzania and Uganda, causing a widespread infestation of cropland and pastures.
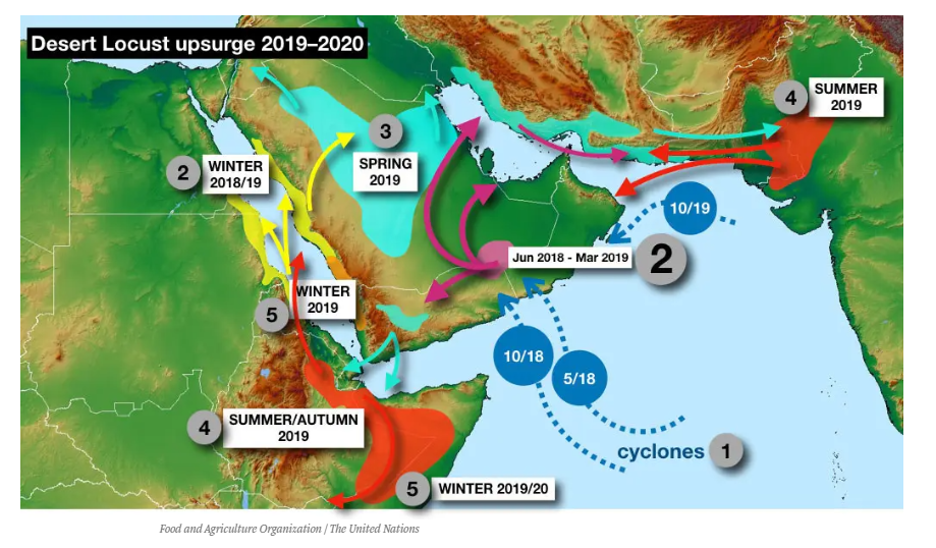
Locust upsurge from Summer 2018 to Winter 2019/20. Source: FAO Locust Watch
According to the Food and Agriculture Organization of the United Nations (FAO 2020), the current swarms of locusts present the most serious outbreak East Africa has seen in decades and is a risk to food security and livelihoods for millions of people. A swarm the size of one square kilometer can consume the same amount of food as 35,000 people in one day, and swarms can reach up to several hundreds of square kilometers (FAO 2015).
Technologies and tools that support better monitoring of locust movements, their impacts, and risk mitigation activities are needed. Satellite Earth observation (EO) technology already provide synoptic information on vegetation vigor and stress, climate, soil moisture, and other variables that help manage outbreaks and mitigate impacts. However, can EO data and spatial analysis provide information on locust presence by monitoring impacts to the vegetation?
RAPID ASSESSMENT OF EO FOR LOCUST OUTBREAK MANAGEMENT
The European Space Agency’s Earth Observation for Sustainable Development (EO4SD) - Fragility, Conflict, and Security (FCS) cluster completed a rapid evaluation to assess the use of EO data to detect the direct impact (damage) of the locust infestation on croplands in Ethiopia. The evaluation objectives were:
- Evaluate FAO’s eLocust3 data to identify locations with high locust density in eastern Ethiopia – eLocust3 data are field-based observations of locust locations and information on control operations.
- Calculate spectral vegetation indices using time series of Sentinel-2 data aligning with pre- and post-locust outbreak months.
- Analyse spectral vegetation anomalies over a 5-year period (2014-2019) for months pre-and post-locust outbreak using Sentinel-2 and PROBA-V products.
ELOCUST3 FIELD DATA
FAO’s eLocust3 is a digital survey system for all locust affected countries in Africa, Arabia and Asia, where field observation on locust presence, abundance, and life cycle stage, and information on soil moisture, vegetation status, habitat type, and treatment control are collected (Cressman et al., 2016).
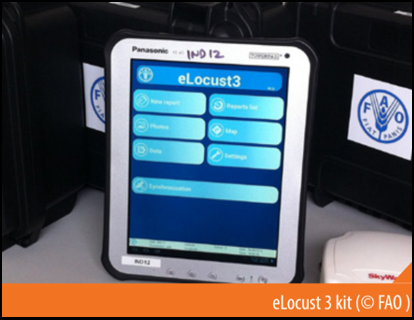 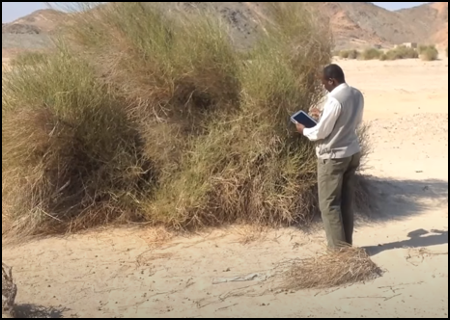 |
eLocust3 digital survey system. Source: FAO 2019
eLocust3 data collected over East Africa confirmed a rapid expansion of locust swarms across Ethiopia from August to December 2019. Many observations and upsurges of locusts were recorded in November 2019 near the city of Jijiga, in the eastern Somali region of Ethiopia. The figure below illustrates the spread of the swarm through Somalia into eastern Ethiopia between August and December 2019.
A CLOSER LOOK AT JIJIGA, ETHIOPIA
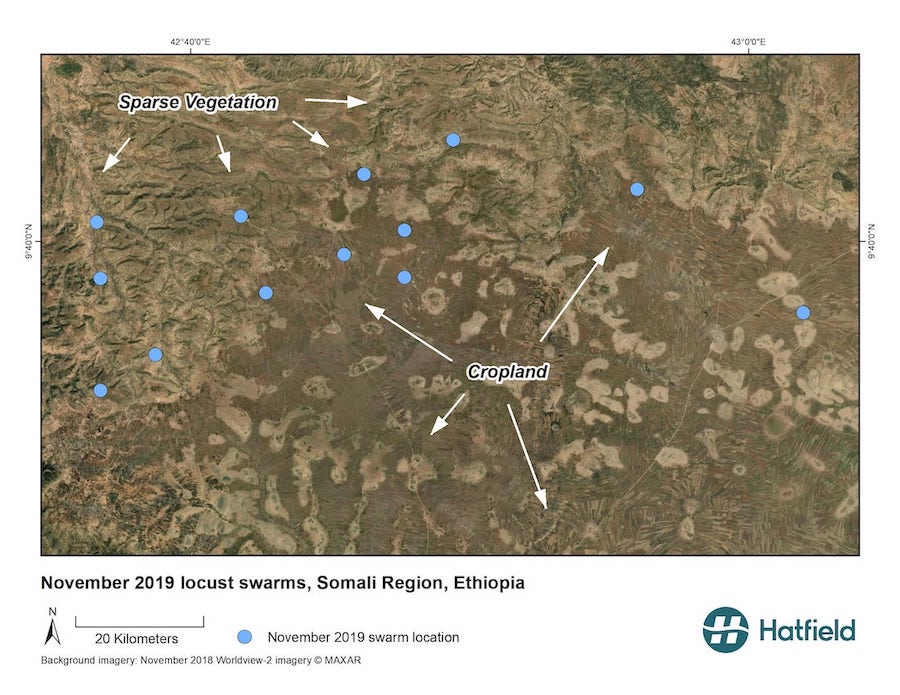
The area north of Jijiga city is a relatively flat landscape with rolling hills characterized by a mosaic of croplands and sparse vegetation. The upsurge of swarms in this region originated from the north and east, and 13 individual eLocust swarm observations were made by the end of November 2019, as shown in the image below.
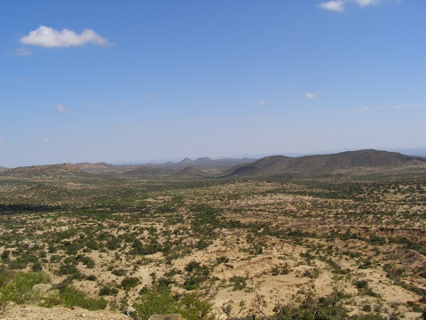 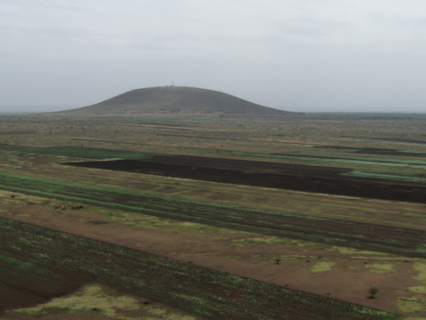 |
Sparse Vegetation north of Jijiga city (left) and Cropland north of Jijiga city (right) November 2018, Google Maps Photos
INVESTIGATING A TIME SERIES OF SPECTRAL VEGETATION INDEX IMAGES
To assess the ability of EO to detect impacts from the locust swarms on the surrounding vegetation, Normalized Difference Vegetation Index Red-Edge (NDVIre; Delegido et al., 2011) was derived from Sentinel-2 images. NDVIre is a vegetation index that is known to be more sensitive to changes in vegetation chlorophyll content and Gross Primary Productivity (GPP) compared to conventional spectral indices as it leverages information from the red-edge spectral domain (Lin et al., 2019).
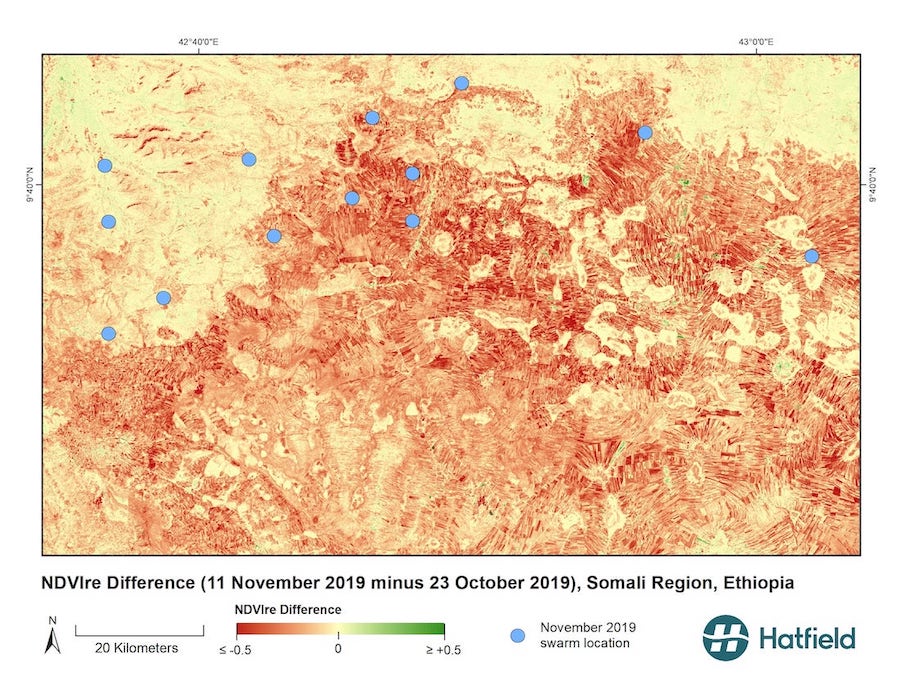
Change detection analysis was performed between November 2019 NDVIre image – when the swarms were first detected – and October 2019 NDVIre representing pre-swarm conditions. The analysis shown in the image below revealed a marked decrease in NDVIre over most of the agricultural areas between October and November, which indicates a decrease in vegetation vigor. However, this decrease in vegetation could be a natural seasonal occurrence.
To evaluate whether this decrease in vegetation vigor is a deviation from historical trends, median NDVIre values for November from 2015 to 2018 were calculated and compared to November 2019 NDVIre values. This approach helps characterize the health of vegetation for a specific month relative to typical conditions over the past three years and allows the potential to identify anomalies – the results are shown below.
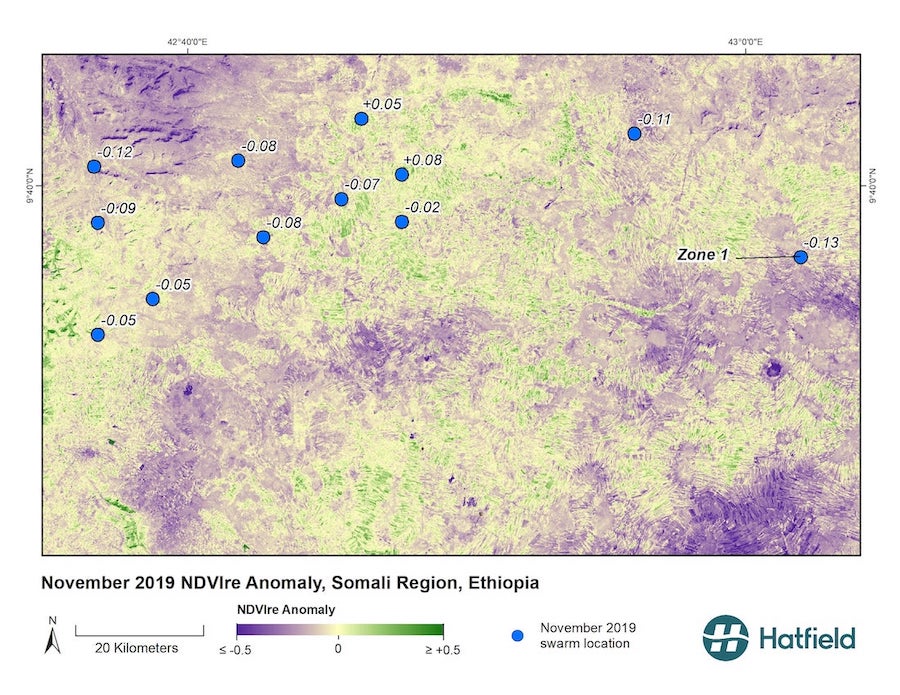
The analysis shows slightly lower NDVIre values in November 2019 compared to historical levels, however mostly located over sparsely vegetated areas and away from detected locust swarms. This shows that small differences in vegetation vigor between the current and previous years were detected for most swarm locations reported by the eLocust3 data.
Plotting the time series profile of NDVIre for the location labelled ‘Zone 1’ (see time series graph), NDVIre in late November and December 2019 are lower than all previous years observed by the Sentinel-2 satellite. The time series graph also highlights abnormally high NDVIre values in September and October 2019, prior to the locust swarms.
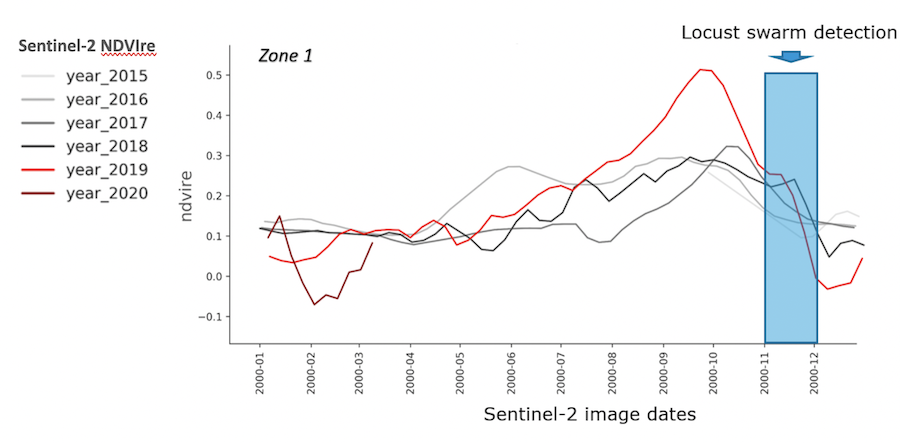
These decreases in NDVIre cannot solely be attributed to the impact of the swarms since seasonal decrease in vegetation vigor normally occurs in November and December, in addition to normal harvesting practices. This, coupled with abnormally abundant vegetation prior to the locust infestation, hinders the ability to separate the spectral signal of the locust impact from normal changes in vegetation.
The analysis, however, illustrates the clear ability of EO data to identify vegetation anomalies through time series analysis. Identifying areas of abnormally high vegetation compared to historical averages could provide strategic information to support risk mitigation measures (e.g. locust control activities).
INVESTIGATING ANOMALIES IN VEGETATION PRODUCTIVITY
Using the Copernicus Global Land Monitoring Service’s FAPAR product (Fraction of Absorbed Photosynthetically Active Radiation) acquired by the PROBA-V satellite, we further investigated the vegetation anomaly between 2014 and 2019. The Copernicus Global Land Monitoring Service’s FAPAR product offers the advantage of being generated operationally at a global scale every 10 days, with a spatial resolution of 300 meters, which is suitable for regional monitoring. FAPAR quantifies the fraction of the solar radiation that is intercepted by leaves for photosynthetic activity, therefore, FAPAR is well suited to monitor the seasonal cycle and inter-annual variability of vegetation photosynthetic activity and is often used for operational crop monitoring (Copernicus Global Land Service 2020).
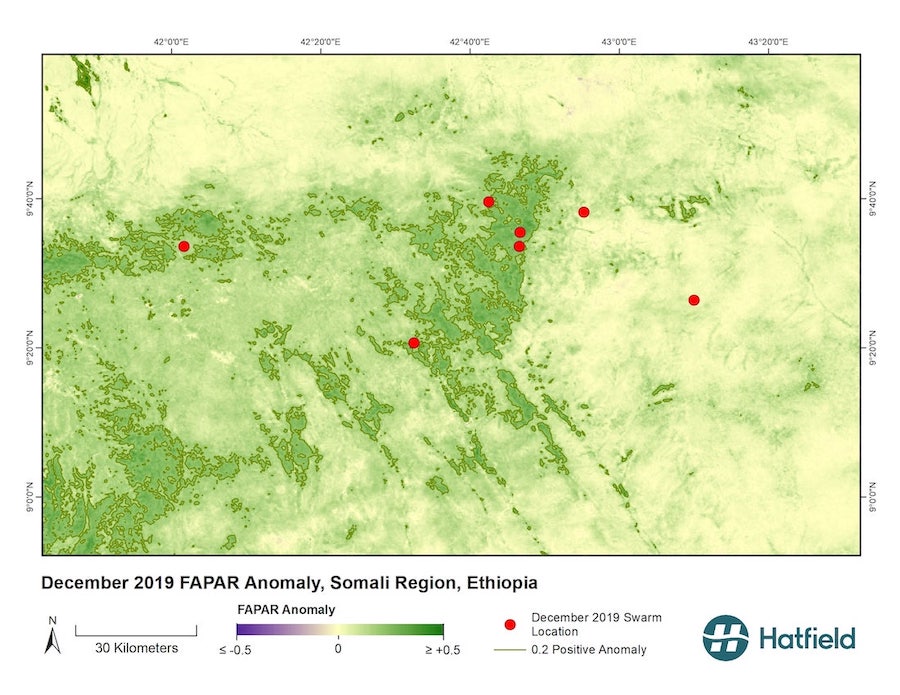
Applying the same approach for Sentinel-2 derived NDVIre data, November and December 2019 FAPAR values were compared to historical median values. Like the Sentinel-2 analysis, minimal differences were detected for November 2019 FAPAR compared to historical values. However, FAPAR increases in localized areas in December 2019 compared to historical values, which appear to coincide with observed swarm locations reported by the eLocust3 data for December 2019.
This suggests that swarms may be moving to areas with unusually high vegetation growth, during a period when vegetation is generally senescing across the region. The image below highlights these anomalies, with values exceeding the historical average by 20% highlighted with a dark green outline.
CONCLUSIONS
- Copernicus Sentinel-2 and PROBA-V FAPAR time series were analyzed to assess locust impacts on vegetation in the Somali Region of Ethiopia.
- Seasonal decreases in vegetation vigor occurred at the same time of the reported locust swarm infestation. This coupled with abnormally abundant vegetation prior to the locust infestation makes it challenging to detect and identify direct locust impacts.
- Time series analysis to identify anomalies compared to historical conditions indicate that vegetation anomalies may be useful to identify areas of higher risk of locust infestation.
Coupled with climate and soil moisture data, EO data and derived products can provide strategic and up-to-date information to support monitoring of potential locust breeding and swarming areas and offer a decision support tool to improve response and mitigation efforts. High spatial resolution data provided by the Sentinel-2 satellites allow for more detailed and targeted information not possible by the regional datasets provided by medium resolution satellites, such as PROBA-V and MODIS.
ACKNOWLEDGMENTS
This analysis was completed by the FCS consortium as part of the EO4SD FCS project. We thank the FAO for sharing elocust3 data for this analysis and the World Bank staff for providing guidance and feedback on the preliminary analyses.
REFERENCES
Copernicus Global Land Service website, Consulted on April 27, 2020, https://land.copernicus.eu/global/products/fapar
Cressman, K., Van der Elstraeten, A., & Pedrick, C. (2016). eLocust3: An innovative tool for crop pest control. http://www.fao.org/3/a-i6058e.pdf
Delegido, J., Verrelst, J., Alonso, L. and Moreno, J., 2011. Evaluation of sentinel-2 red-edge bands for empirical estimation of green LAI and chlorophyll content. Sensors, 11(7), pp.7063-7081.
FAO 2015, FAO Desert Locust Information Service, Consulted on April 28, 2020. http://www.fao.org/emergencies/resources/documents/resources-detail/en/c/278608/
FAO 2020, FAO appeals for urgent support to fight worsening Desert Locust upsurge in the Horn of Africa, Consulted on April 23, 2020. http://www.fao.org/news/story/en/item/1259082/icode/
Lin S, Li J, Liu Q, Li L, Zhao J, Yu W. Evaluating the Effectiveness of Using Vegetation Indices Based on Red-Edge Reflectance from Sentinel-2 to Estimate Gross Primary Productivity. Remote Sensing. 2019 Jan;11(11):1303.